Mammalian
Toxicology, Session 9
Mammalian
toxicity testing: in vivo, in vitro, multigeneration;
C 2, 8, 9, 10, 20; Molecular methods, high throughput testing; C 9, 31
The penultimate versions of
projects should be submitted (via e-mail or the Web) over the next few days and
all members of the class should review and comment on each of them over the
next two weeks.
Analytical
Considerations
Most of the topical coverage
today turns on assays of various sorts. Forensic, clinical, and
environmental toxicology all depend on the application of a battery of physical
chemical methods along with a large array of biological test assays.
There are common concepts that must be considered in running any and all
of these analyses. Indeed, these questions arise whenever an analytical
method is being developed and validated. Not just in toxicology, but in
endocrinology, immunology, analytical chemistry, molecular biology,
microbiology, etc. What is a real signal or response in a given
assay? What is due to instrumental or biological background or noise? How
reproducible are the signal versus input relationships? Do our
predictions of the content of an analyte in a
reference source agree with the known content, i.e., how accurate is the
method used? Can the method sense the amounts of analyte
present in a given test sample; how sensitive is the technique? Is the
method specific for the analyte of interest, or does
it respond both to the analyte and to other compounds
that may be present in the sample which share some molecular feature but do not
necessarily share biological impact?
Coverage of much of this
material can be found in: Chan, Immunoassay: A Practical Guide, AP:
Orlando, FL, 1987; Gosling, Immunoassays: A Practical Approach, OUP:
Oxford, UK, 2000; Tietz, Textbook of Clinical
Chemistry, Saunders: Philadelphia, PA, 1986; or Campbell & Wood, An
Introduction to Quantitative Endocrinology, In Wood, Dynamics of
Human Reproduction: Biology, Biometry, Demography, Aldine de Gruyter: New York, NY, 1994.
So, in running assays how do
we account for alternative causes of signal and background signal? This
requires being able to distinguish a signal due to the causative agent from a
signal due to background noise. This is best accomplished by use of an
assay that is well characterized and validated. For both bioassays and
analytical assays this means the assay must operate within well-characterized
ranges for a series of quality control parameters. These are criteria for
valid assays:
1. Precision -- reproducibility (A given input
results in a predictable output.)
2. Sensitivity (Limit of Detection) -- this is the
lowest measurable, nonzero dose (e.g., LOAEL); also, in a chemical analytical
sense, the slope of the response curve, dY/dX, the
ability to differentiate one dose from the next.
3. Accuracy -- evaluation of reference standards
yields expected results (as determined by an independent method or from a
consensus of others running similar tests on the same standard materials)
4. Specificity -- the assay measures the intended analyte or parameter even in the presence of potentially
interfering substances (lack of specificity = nonspecificity
or cross-reactivity)
Bias is found when a result curve is obtained
that is different from that seen in another assay. The idea combines
sensitivity and specificity dimensions.
Note that a high signal to
noise ration, S/N, implies a high analytical sensitivity. It will do well
in discriminating the presence of signal from background.
All of these criteria can be
expressed mathematically for any given assay. Precision is given as the coefficient of
variation, CV, calculated as the standard deviation of replicate measurements
of a single sample divided by the mean result for that measurement, SD/M.
Intra-assay CV is computed from data within a single
assay while inter-assay CV
is computed across repeated assays of the same type. The inter-assay CV
is analytically more important as it includes variance derived from all the
minor day-to-day fluctuations that might impact the evaluation of a random
unknown sample. Both CV computations are normally done on a reference
standard or preparation that matches the makeup of unknown samples as closely
as possible. Although this measurement can be done on as few as 2-3
replications, it is not normally considered valid until the number of
replicates exceeds 20. This magic number, 20, is also the number of
replicates normally used as the minimum for computing the other quality
assurance parameters (accuracy, limit of detection) mentioned below. For
a chemical analytical technique, an inter-assay CV less than 3-5% is common,
while for bioassays an inter-assay CV of 15-30% may be acceptable.
Obviously the lower the CV the more reproducible results will be and the
better the estimates for analyte content in unknown
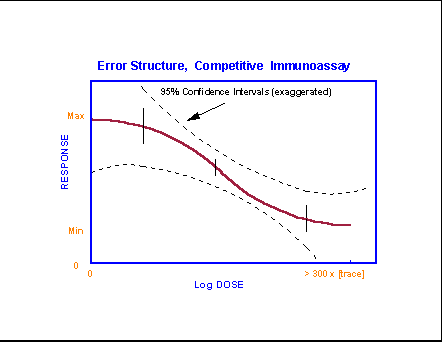
samples will be. Some of this is reflected in the curves for assays and
immunoassays that are reproduced below. Note how the precision error is
propagated into the error of the estimate for unknowns.
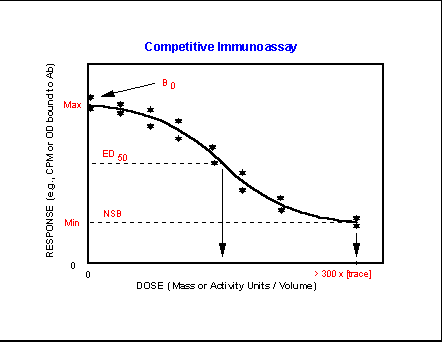
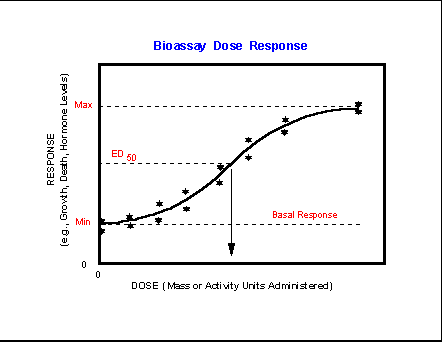
The basic shapes of
response curves are shown along with the minimum, or nonspecific binding, NSB,
or noise response obtained in the absence of any specific analyte
or response of interest. Many assay responses are saturable
and demonstrate an upper response or signal asymptote. In competitive
assays this corresponds to the signal obtained in the absence of added analyte, B0. The effective dose at 50%
response, ED50, corresponds to the Km computed for enzyme
assays.
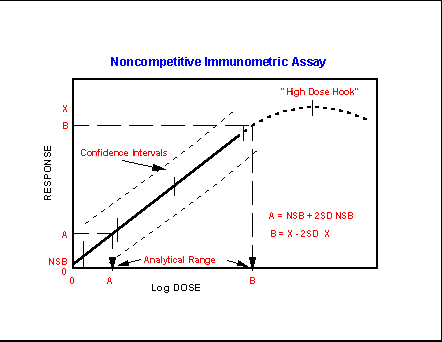
 Noncompetitive binding assays resemble
the curves obtained for many physical chemical analytical assays in that the
signal rises nearly linearly for each increment of analyte
added. The signal may or may not demonstrate an upper asymptote, or saturation,
but often does. Note that in both competitive and noncompetitive
situations there is a limited range over which the assay follows a
monotonically changing (decreasing or increasing) tragectory.
This is the useful analytical range. For any of the analytical
curves there will be a degree of imprecision in measurement that will be
greatest at the lowest and highest concentrations of analyte
measured. In a strictly linear response assay this would be constant from
one end of the assay response curve to the other. However, because noise
makes up a substantial amount of the available signal or response at the lowest
values and because it is rare for an assay technique not to become saturated at
sufficiently high analyte loads, the deviation from
linear error distribution is the rule rather than the exception. The
“High Dose Hook” in a noncompetitive binding assay also often applies to
instrumental methods where analyte loads above the
point of saturation often decrease rather than increase the signal for any further
increments of analyte.
Noncompetitive binding assays resemble
the curves obtained for many physical chemical analytical assays in that the
signal rises nearly linearly for each increment of analyte
added. The signal may or may not demonstrate an upper asymptote, or saturation,
but often does. Note that in both competitive and noncompetitive
situations there is a limited range over which the assay follows a
monotonically changing (decreasing or increasing) tragectory.
This is the useful analytical range. For any of the analytical
curves there will be a degree of imprecision in measurement that will be
greatest at the lowest and highest concentrations of analyte
measured. In a strictly linear response assay this would be constant from
one end of the assay response curve to the other. However, because noise
makes up a substantial amount of the available signal or response at the lowest
values and because it is rare for an assay technique not to become saturated at
sufficiently high analyte loads, the deviation from
linear error distribution is the rule rather than the exception. The
“High Dose Hook” in a noncompetitive binding assay also often applies to
instrumental methods where analyte loads above the
point of saturation often decrease rather than increase the signal for any further
increments of analyte.
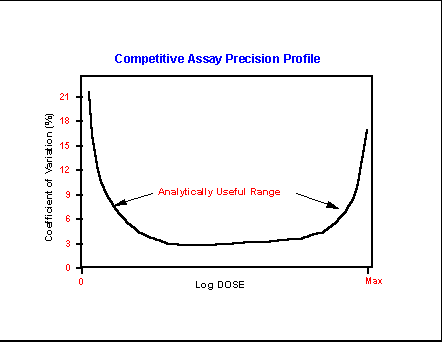 Plotting CV versus analyte
concentration produces a plot that demonstrates the expansion of analytical
error that occurs at the lowest and highest analyte
loads. Depending on the assay, the useful analytical range will spand the bottom, or near-linear
portion of the “U” profile and include analyte levels
within an acceptable error range. Outside that range error may negate the
utility of the assay entirely. Or it may limit its use to a qualitative
“yes” or “no” indication that the analyte levels are
above or not above the levels seen as background noise.
Plotting CV versus analyte
concentration produces a plot that demonstrates the expansion of analytical
error that occurs at the lowest and highest analyte
loads. Depending on the assay, the useful analytical range will spand the bottom, or near-linear
portion of the “U” profile and include analyte levels
within an acceptable error range. Outside that range error may negate the
utility of the assay entirely. Or it may limit its use to a qualitative
“yes” or “no” indication that the analyte levels are
above or not above the levels seen as background noise.
Looking at the Limit of detection for an assay usually means defining a
level of analyte that, when added to a sample known
not to contain the analyte beforehand, produces a
signal that is statistically different from the signals found for repeated
measurements of an uncontaminated sample, or zero control. This is
normally defined as the analyte level (concentration
or mass) that generates a response signal that exceeds the zero dose signal
mean plus (or minus for a decreasing signal assay) 2 (or 3) standard deviations
of the zero dose signal mean. This corresponds to the upper 95% (or 99%)
confidence interval about the zero control signal mean. Note that precision
contributes to this estimation as well as the actual sensitivity (slope of the
analytical curve) of the measurement. Noise or background in an
analytical system takes many forms: fluctuation of an electrical source leading
to fluctuation in a photometric light source or the voltage across a
photomultiplier tube, sunspot activity that can randomly alter the signal
levels detected by a radiation counter, individual genetic variations among
test animals that lead to differences in basal metabolic activities, chemical
or temperature gradient differences among replicated cell or bacterial cultures
arising from such variables as the position of the culture within the growth
chamber, or fluctuations in vacuum systems arising from slight variations among
samples in content of non-analyte volatile chemicals.
Many of these cannot be readily controlled or they arise stochastically
and are by definition uncontrollable.
 While noise contributes primarily to
limitations on the lowest level of analyte that may
be reliably detected, other forms of imprecision (gravimetric errors,
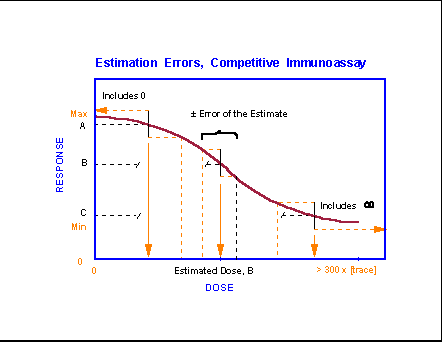
volumetric errors, timing errors) have equal impact on the estimation analyte levels above the zero value. Whenever an analytical
method demonstrates a nonlinear response curve (almost always), there will be
an area (shown for unknown A) in which the estimation error will cause a signal
to be indistinguishable from a zero analyte level.
And, there will be an area (shown for unknown C) in which the response
will be indistinguishable from that found for an infinite (above saturation)
level of the analyte. The useful analytical range,
and the range in which reference standards should be prepared, falls between
these two levels. Note how precision, reproducibility of estimation,
particularly of known standards, controls the error of the estimate and the
anticipated precision of the measurements.
While noise contributes primarily to
limitations on the lowest level of analyte that may
be reliably detected, other forms of imprecision (gravimetric errors,
volumetric errors, timing errors) have equal impact on the estimation analyte levels above the zero value. Whenever an analytical
method demonstrates a nonlinear response curve (almost always), there will be
an area (shown for unknown A) in which the estimation error will cause a signal
to be indistinguishable from a zero analyte level.
And, there will be an area (shown for unknown C) in which the response
will be indistinguishable from that found for an infinite (above saturation)
level of the analyte. The useful analytical range,
and the range in which reference standards should be prepared, falls between
these two levels. Note how precision, reproducibility of estimation,
particularly of known standards, controls the error of the estimate and the
anticipated precision of the measurements.
Accuracy describes the ability of an assay to
reproduce the value of a reference or control sample that has been either
composed using direct gravimetric means or has been evaluated by an
independent, previously validated, method. The National Bureau of
Standards spends much of its time verifying methodologies and putting together
reference preparations for all sorts of analytical techniques. The
American Association of Clinical Chemists provides reference samples and a
reference sample exchange program for clinical chemistry labs in which samples
generated by the Association or key member laboratories are provided to
participating laboratories and the collective results are compiled and compared
to ascertain which laboratories and methods (if more than one is used) are
accurately measuring the known content of the samples in question.
Methods that measure single molecules or their fragments tend to be used
as the reference methodologies to which all others are compared. They are the
“Gold Standard” methods because of their absolute specificity, their
sensitivity to the presence of any signal, and to their proportional response
to increasing quantities of analyte. Their normal
drawback is that they often require extensive manipulation of the sample prior
to introduction into the analytical instrumentation. This is normally in the
form of extraction or chromatographic separation of the analyte
from the other components of the original sample matrix. Thus, these
methods while exquisitely sensitive and specific, tend to be very time
consuming and expensive with respect to sample preparation. For good
reference materials this makes considerable sense. But for routine samples
it is definitely an impediment and means that secondary methods are often the
first used for routine diagnostics or analyses.
Sample matrix includes all
those elements of a sample other than the analyte of
interest. If there is nothing in the matrix that is capable of perturbing
the analytical method being used, the entire sample, or a subsample
of it, may be introduced directly into the assay. In that instance no
change in the standard curve or its quality assurance parameters (precision,
limit of detection, accuracy) should take place relative to what would be seen
if pure analyte suspended in a neutral matrix like
pure water, pure solvent, or cellulose paper were introduced into the
analytical system. If, however, something in the matrix makes the analyte less accessible, e.g., adsorption to
charcoal particles or serum binding proteins, or chemically resembles the analyte, e.g., shares key reactive groupings that
are detected by a colorimetric reaction or is a metabolite of the analyte that can bind to antibodies raised against the analyte of interest, or is capable of inhibiting a reaction
or response of interest, e.g., high acidity that will prevent an
antibody binding reaction from occurring or the presence of compounds that
inhibit Taq polymerase in a PCR assay, then
the analytical protocol used must either extract the analyte
from the sample matrix or neutralize the interference by otherwise manipulating
the sample. If extraction is involved the recovery of analyte
from samples with an identical or similar matrix must be determined so that
corrections can be applied that recognize the losses that have occurred during
this step of the analysis. Alternatively, a molecule with very similar
characteristics can be added in known quantity to the sample prior to
extraction, e.g., a tritiated or deuterated form of the analyte of
interest, as an internal standard. Estimation of the content of internal
standard after the extraction then allows for correction for this analytical
step. In many molecular assays a probe or construct similar to that of
analytical interest is included as a control. This often acts as an
internal standard that can reflect procedural losses leading up to the final
analytical measurement by techniques such as PCR, Southern blotting, or
Northern blotting.
If extraction is not
performed prior to introduction of the sample into an assay, several common
manipulations may still allow differentiation of the analyte
signal from those that might arise from any matrix components. Sample dilution
often reverses adsorption of the sample onto particles or carrier proteins in
addition to decreasing the concentrations of all components of the sample.
If the analyte of interest has a steeper
response curve than any competitors in the matrix, sufficient dilution may
allow specific analyte detection even in the presence
of matrix interferences. The problem here is to avoid dilutions that
carry the analyte levels to those near or below the
limit of detection of the method. Dilution of inhibitors may also obviate the
need for extracting the analyte from the matrix prior
to introduction into the assay. But simple sample manipulations may also
accomplish the same thing: boiling may free an analyte
from binding proteins or remove inhibitory enzyme activities or volatile
components, acidification or alkalinization followed
by neutralization may decompose analyte conjugates or
interfering molecules, addition of an excess of enzyme substrate or a metal chelator may inactivate a competing enzyme, or selective
precipitation of one or more classes of macromolecules may allow unfettered
access to the analyte of interest. Finally, if
there is ample reason to assume that virtually all samples to be examined will
contain similar quantities of matrix interferences, the sample may be directly
introduced into the assay so long as any standards or reference preparations
are made up in a similarly comprised matrix.
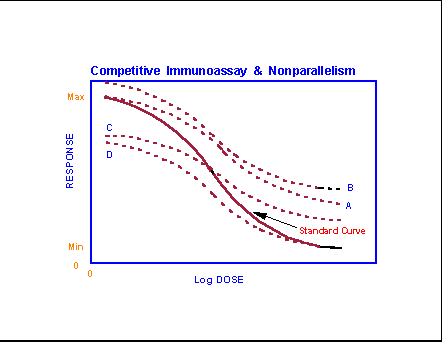 The impact of several deviations from
identical sample matrix composition can be seen in this figure which compares
the results for a standard curve with those obtained by serially diluted
samples. Plots A & B depict the loss of sensitivity that tends to
occur in the presence of analyte binders which can
either elevate the zero dose response by removing basal levels of analyte or flatten the response curve by decreasing the
effective signal production by any increment in analyte.
Plots C & D demonstrate the problems raised by the presence of
cross-reactive molecular species which may suppress the signal for the zero
dose (in competition assays, by competing with tracer for the binding agent)
and then continue to suppress incremental analyte
signal (C) throughout the analytical range, or suppress the signal only until
sufficiently diluted (D). Note that combinations of such impacts often
occur. All tend to change the shape of the response curves in any
analytical method. The change in shape relative to the standard curve means
that such assays demonstrate nonparallelism, i.e., the dilution curves are
not superimposable on the curve for the reference
standards. When this happens, unknown estimates cannot be reliably
predicted on the basis of the parameters described for the reference standards
or any control preparations that may be run routinely in the assay. In
such circumstances, the assay will either have to be treated as a qualitative
assay or a series of recovery standards must be prepared that covers the full
analytical range. When these are assayed, they will define a line that
can be used to provide correction factors appropriate to all dilutions used for
the assay. Less ideal, they will describe a mean correction factor and
error band that can be incorporated into any estimation errors for samples
measured by this assay.
The impact of several deviations from
identical sample matrix composition can be seen in this figure which compares
the results for a standard curve with those obtained by serially diluted
samples. Plots A & B depict the loss of sensitivity that tends to
occur in the presence of analyte binders which can
either elevate the zero dose response by removing basal levels of analyte or flatten the response curve by decreasing the
effective signal production by any increment in analyte.
Plots C & D demonstrate the problems raised by the presence of
cross-reactive molecular species which may suppress the signal for the zero
dose (in competition assays, by competing with tracer for the binding agent)
and then continue to suppress incremental analyte
signal (C) throughout the analytical range, or suppress the signal only until
sufficiently diluted (D). Note that combinations of such impacts often
occur. All tend to change the shape of the response curves in any
analytical method. The change in shape relative to the standard curve means
that such assays demonstrate nonparallelism, i.e., the dilution curves are
not superimposable on the curve for the reference
standards. When this happens, unknown estimates cannot be reliably
predicted on the basis of the parameters described for the reference standards
or any control preparations that may be run routinely in the assay. In
such circumstances, the assay will either have to be treated as a qualitative
assay or a series of recovery standards must be prepared that covers the full
analytical range. When these are assayed, they will define a line that
can be used to provide correction factors appropriate to all dilutions used for
the assay. Less ideal, they will describe a mean correction factor and
error band that can be incorporated into any estimation errors for samples
measured by this assay.
Specificity of an assay is reflected in this need to
simplify the sample prior to analysis. If a method is absolutely
specific, it will not display nonparallelism even if
the sample is placed directly into the assay. Moreover, that assay will not
respond to the presence of even closely related compounds.
Cross-reactivity (%) as normally described, by the ratio of the amount of
pure potentially cross-reactive compound needed to generate an assay response
equivalent to the ED50 for the analyte
standard curve to the amount of pure analyte needed
at the ED50 x 100, is a semiquantitative
estimate of how specific the assay method is. In some instances a lack of
specificity is useful in allowing similar groups or families of molecules to be
measured collectively. Often, however, specificity is required to make
certain that accurate results are being obtained for the assay. Think
about the possible end results if a diagnostic PCR assay happens to respond
both to a targeted gene found in a pathogenic organism available only in cultures
held within a Defense Department biological warfare facility and to a pseudogene present in a common commensal
microbe.
Ultimately, most secondary
methods of analysis need to be validated or compared to the results of Gold
Standard methods. Or the analytical results of any type need to be
compared with the clinical or pathological manifestations of toxicity,
physiological response, or presence of disease. A pregnancy test needs to
be verified against the number of clinical pregnancies actually seen in the
weeks or months following testing. A test for measles needs to be
verified against the actual manifestation of measles infection. Such
comparisons among assays or against independent endpoints are often evaluated
using a Chi-square approach where the distinct possible outcomes of the
reference assay or evaluation (for example, development of disease or the known
content of a compound) are placed on the X-axis and compared to the outcomes of
the test assay (or drug trial) on the Y-axis. For a 2x2 evaluation where
each test has yes or no answers (i.e., they are qualitative or semiquantitative) each of the cells can be readily
described.
|
|
Known Condition |
||
|
Positive |
Negative |
||
|
Test
Result |
Positive |
True
+ |
False
+ |
|
Negative |
False
- |
True
- |
|
1. When both tests give
positive assays, the result is entered in a square termed "true
positives," TP.
2. When both are negative,
the result is entered in a square termed "true negatives," TN.
3. When
the reference test is positive, but the test assay is negative, the results are
"false negatives," FN.
4. When
the reference test is negative, but the test assay is positive, the results are
"false positives," FP.
With this information, the
test assay can be evaluated (relative to the reference) by five qualitative
features (note that these are related but not identical to the same qualities
defined by strictly analytical means): Sensitivity, Specificity, Predictive Value for Negative Responses, Predictive Value
for Positive Responses, and overall Efficiency (or Accuracy).
1. Sensitivity = (TP/(TP + FN)); note, this is not the same as lowest measurable
dose or slope of the curve for a single assay.
2. Specificity = (TN/(TN + FP)); this is related to, but not the same as
measuring the intended parameter.
3. Predictive Value for a
Positive Test = (TP/(TP + FP))
4. Predictive Value for a
Negative Test = (TN/(TN + FN))
5. Efficiency = ((TP + TN)/(TP + TN + FP + FN)); this is the overall ability of the
test to correctly predict or the presence of a compound or drug or of an assay
having the expected result.
Because of these
inter-related mathematical definitions, it should be evident that it is
difficult to have assays that are entirely sensitive and specific at the same
time. Indeed, it is often necessary to trade between these two qualities
to generate an optimal assay that has the best efficiency (or accuracy)
possible.
LOAEL, NOAEL, Zero Dose
Note how these appear differently
in a sigmoid model of toxicity in which there is no difference between the
beginning of the dose-response curve and zero dose, i.e., the response
curve is monotonically increasing beginning at zero dose, and in the threshold
model of toxicity in which there is an actual point on the dose axis above zero
dose at which the response falls to zero.
In the monotonically
increasing case, repeated measurements of the dose response curve provide an
error estimate around the points of the dose curve including the zero dose. The mean of the zero dose + 2 (or 3) standard
deviations of the zero dose, define a line through the dose response curve
below which a response cannot be distinguished from the impact of a zero dose.
Since doses are chosen for testing, any dose falling below the line just
described would yield no effect. The highest dose below that line should
be the NOAEL dose. The first dose above that line should be the LOAEL.
Note the line defined could also be referred to as the maximal tolerated
dose, MTD.
The threshold model is a
variant of the linear extrapolation model. The latter assumes there is no
dose that does not have some effect. If our methods are sensitive enough, this
model would, in fact, have no NOAEL or MTD. If, more realistically, there
are physiological mechanisms that pose barriers for toxicity, e.g.,
detoxification systems, sequestration mechanisms, or repair processes, there
will be a dose that does not generate a response in the organism. In this
situation, there will be no response at a finite, nonzero, dose which can be
termed the NOAEL or the MTD. The first dose above that level would be the
LOAEL. Operationally, it is normally impossible to distinguish between a
true threshold model and a sigmoid model given the limits of response
measurement technologies and the finite number of dosages that can be tested.
Thus, the determination of NOAEL, LOAEL, and MTD fall back to the
approach outlined above under the sigmoid model.
What happens with delayed
effects? Cancer, neurodegeneration, immunocompromise (where opportunistic infections by
secondary agents may actually be the ultimate causes of the observed toxic
effect). In all these situations the phase delay between exposure and
toxic response may be difficult or impossible to detect above background
"noise." But the obvious places to begin exploring these
situations are in the tissues most potentially affected. In the case of
cancer this would probably be most prominent in the tissues demonstrating the
most active proliferation: testicular germinal epithelium, bone marrow, lining
of the small intestine, placenta, or embryonic tissues. Note how the
clearance and repair processes make the connection of cause and effect even
harder because the causal agent may be cleared long before the impacts of its
effects are expressed by the biological systems triggered to set in motion
processes or cascades that are proximally responsible for observed effects.
Practically, these delays
have important impacts on the process of testing drugs and food additives since
they may take 10-20 years or more to become apparent. Current patents are
only good for 17-20 years including much of the time needed for the later
phases of testing. There is little wonder companies try to optimize profits
through the course of the initial patent as they need to address the costs not
only of development, but also of liability litigation that may arise as a
result of delayed untoward effects that may not be made apparent during the
time of testing. Animal models are not perfect substitutes for humans and
not all humans can be adequately modeled even with other humans.
So the question arises as to
whether the potential for delayed deleterious toxic effects might be grounds
for delaying the granting of a patent, prolongation of the testing phase, governmentalization of the responsibility for prolonged
testing, or automatic patent renewal if no such deleterious effects are
reported during the initial patent.
Available
Assays
While C&D provides a
lengthy list of methodologies for biological assays involving mutagenesis and
carcinogenesis their coverage of analytical methods is quite weak. I
would refer you to any good current analytical chemistry text for information
on instrumental methods such as: colorimetry, spectrophotometry, fluorimetry,
radiometry, flow cytometry, quantitative cytology and
image analysis, detection methods for gas and liquid chromatography (electron
capture, radiometry, ionization, flame photometry, refractive index, and spectrophotometry), thin layer chromatography, nuclear
magnetic resonance spectrometry, mass spectrometry, PCR, quantitative
electrophoresis, dot-blotting, electron microprobe analysis, flame photometry,
atomic absorption spectrometry, and microarray
analysis. A search on Google for any of these terms will often turn up
libraries and professional association pages containing specifics and
peculiarities of each of these methods. Not all of them require sample
extraction prior to application and many are becoming more widely adapted for
use in high throughput laboratories.
Particular cases in point for
high volume analysis are various versions of spectrophotometry,
automated chromatography (gas, liquid, thin layer), and microarray
analyses. By using robots to subsample, extract,
concentrate (via lyophilization or solid-phase
extraction followed by elution into more favorable solvents), and apply or
inject samples into microplate wells or onto chromatography columns, many labor
intensive methods have moved from the research laboratory to the clinical,
pharmaceutical, or toxicological laboratory where huge numbers of samples are
processed in a given year.
Automation allows
immunoassays in a variety of formats, cell and microbial cultures, and even
protein or nucleic acid mass spectral analyses to be performed nearly
unattended between sample loading and endpoint readout. In all these
cases the validation and development work on the methods provides the substrate
for confidence in the overall results when it is coupled with use by operators
that monitor the appropriate quality assurance parameters and that interpret
the results with full understanding of the actually unattended operations
taking place.
The use of microarrays are particularly important in toxicological
analyses because these are now being prepared to allow demonstration of DNA
matching most of the genetic loci in several different organisms, RNA matching
those expressed in cells of several different tissues in each of several
species, and proteins expressed in several different tissues in each of several
species. Thus, tools are now being constructed that will allow
investigators to look at tissue samples from intoxicated subjects and determine
if these tissues contain damaged DNA, and altered patterns of RNA or protein
transcripts relative to those of unintoxicated
individuals. The primary need in this area currently are improvements in
methods for collecting, collating, and associating the information gleaned from
each of the thousands of data points collected on each individual chip while at
the same time maintaining good quality assurance values for precision,
accuracy, specificity, and sensitivity for each element in the array being
used.
Note also the differing goals
of toxicological forensic laboratories and clinical toxicological laboratories
as noted in C&D. The former is often attempting to push assay
sensitivity limits to deal with small samples or low toxicant loads and is
frequently forced to use qualitative results (detectible vs
nondetectible) while the latter is frequently most
concerned with quantitative results that allow medications to be held to the
effective but nontoxic range.
While an exhaustive list of
methods and related sites is beyond the scope of this course these are
appropriate for looking up toxicological methods and applications.
ASTM testing methods:
chronic oral toxicity: http://www.astm.org/DATABASE.CART/PAGES/E1619.htm
ASTM Bioassay Table:
http://www.dtsc.ca.gov/ScienceTechnology/bioassay/Table.html
Discussion
Questions
NOAEL, LOAEL
& Threshold Model (QS2Q2)
12. Are the concepts of NOAEL and LOAEL most compatible with a threshold level
or a no threshold level conception of dose responses? How are they
represented on dose-response curves? How do they differ from zero dose? Does the last answer change for environmental
exposures if newer methods allow lower limits of detection for the toxicant in
question?
Toxicology
Information (QS2Q5)
15. Search out
the following sites and explore them: HazDat,
EXTOXNET, RTECS, Toxline, IRIS, IARC.
What information do they contain? Do they appear up to date? Print
out some examples of the contents and see if you can interpret them. To
what area(s) of toxicology are each of them relevant?
© 2005
Kenneth L. Campbell